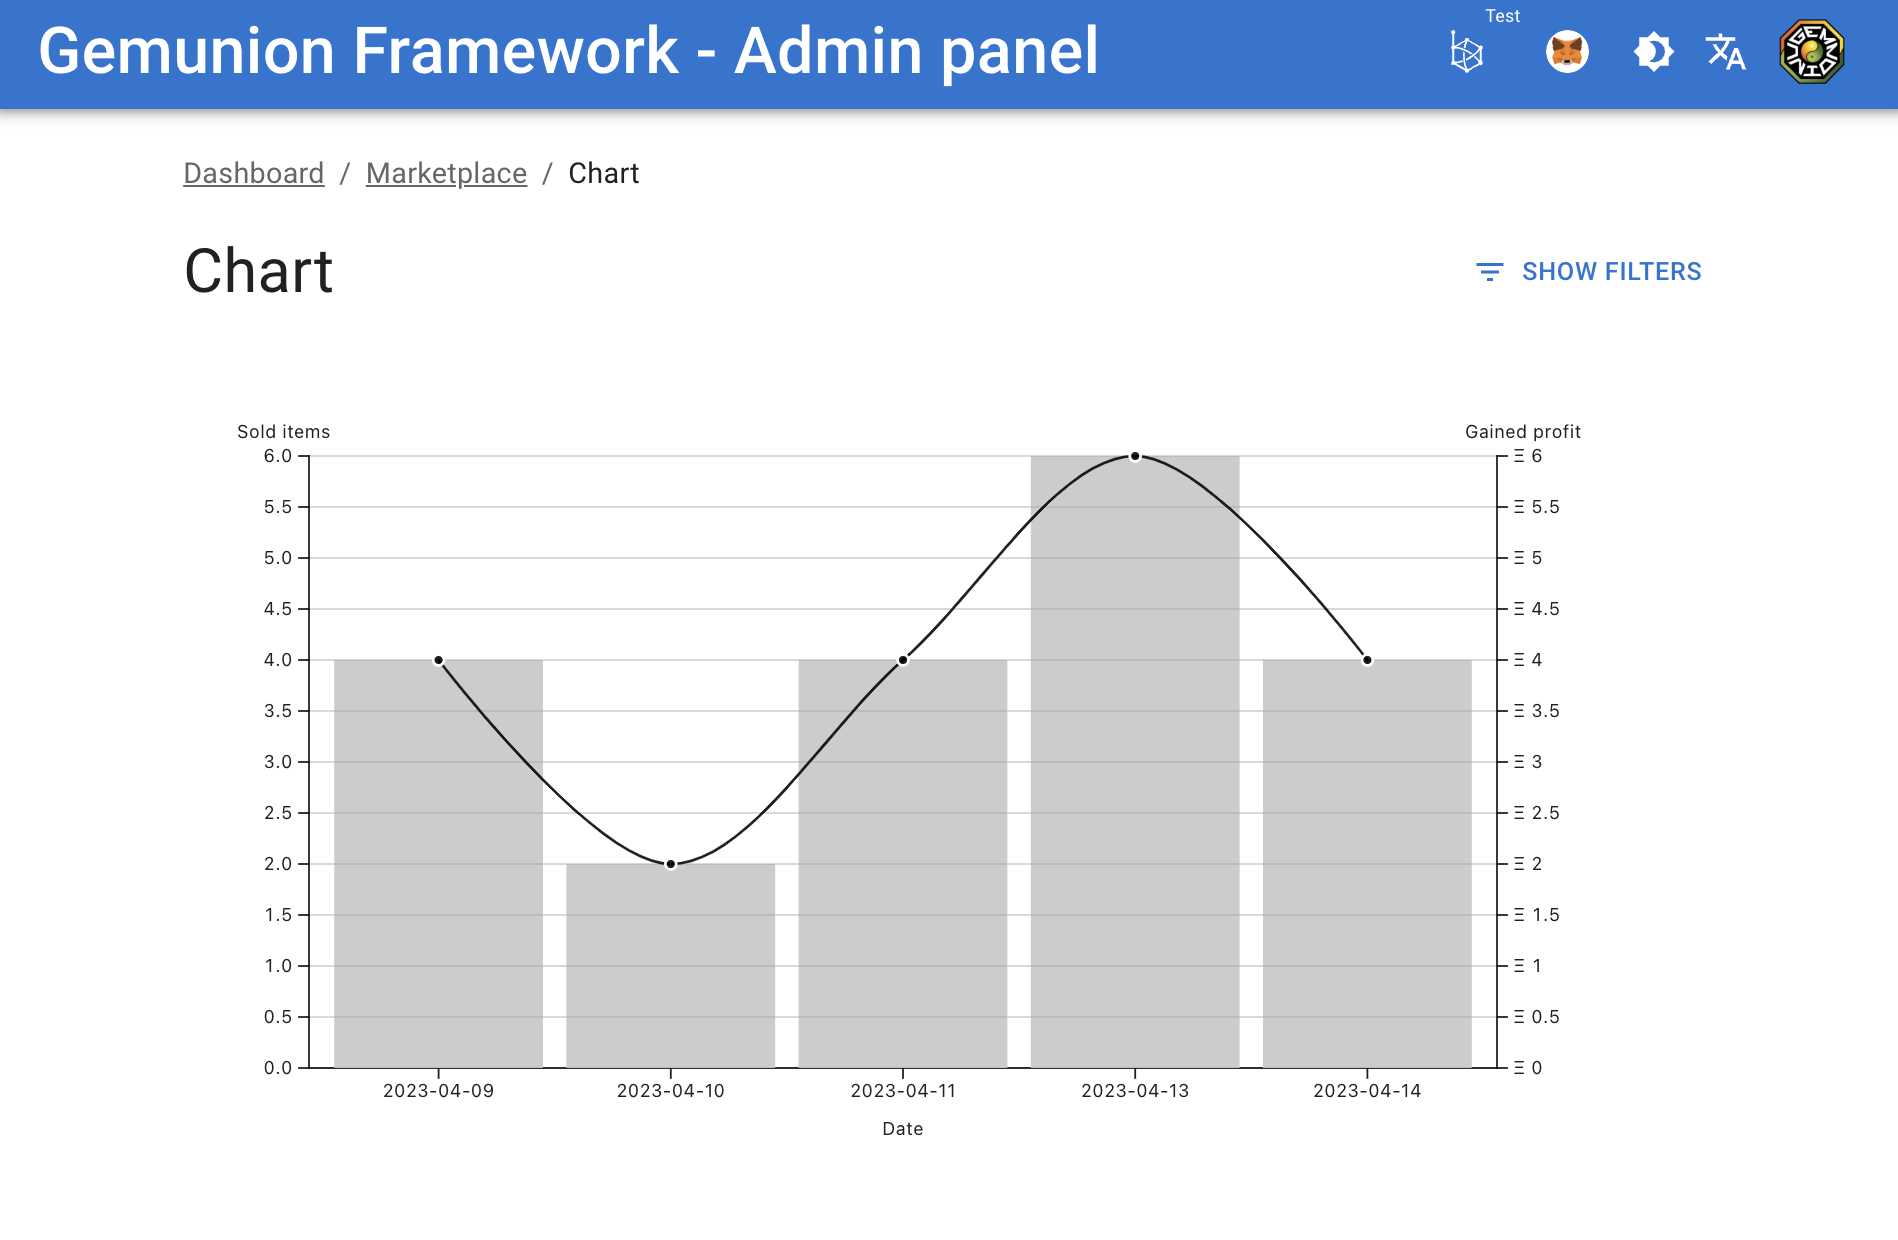
Chart
The chart represents the number of Sold items and the Gained Profit on each date.
The chart consists of two elements:
- Columns: represent the number of purchases made on each date.
- Lines: represent the amount of profit earned on each date.
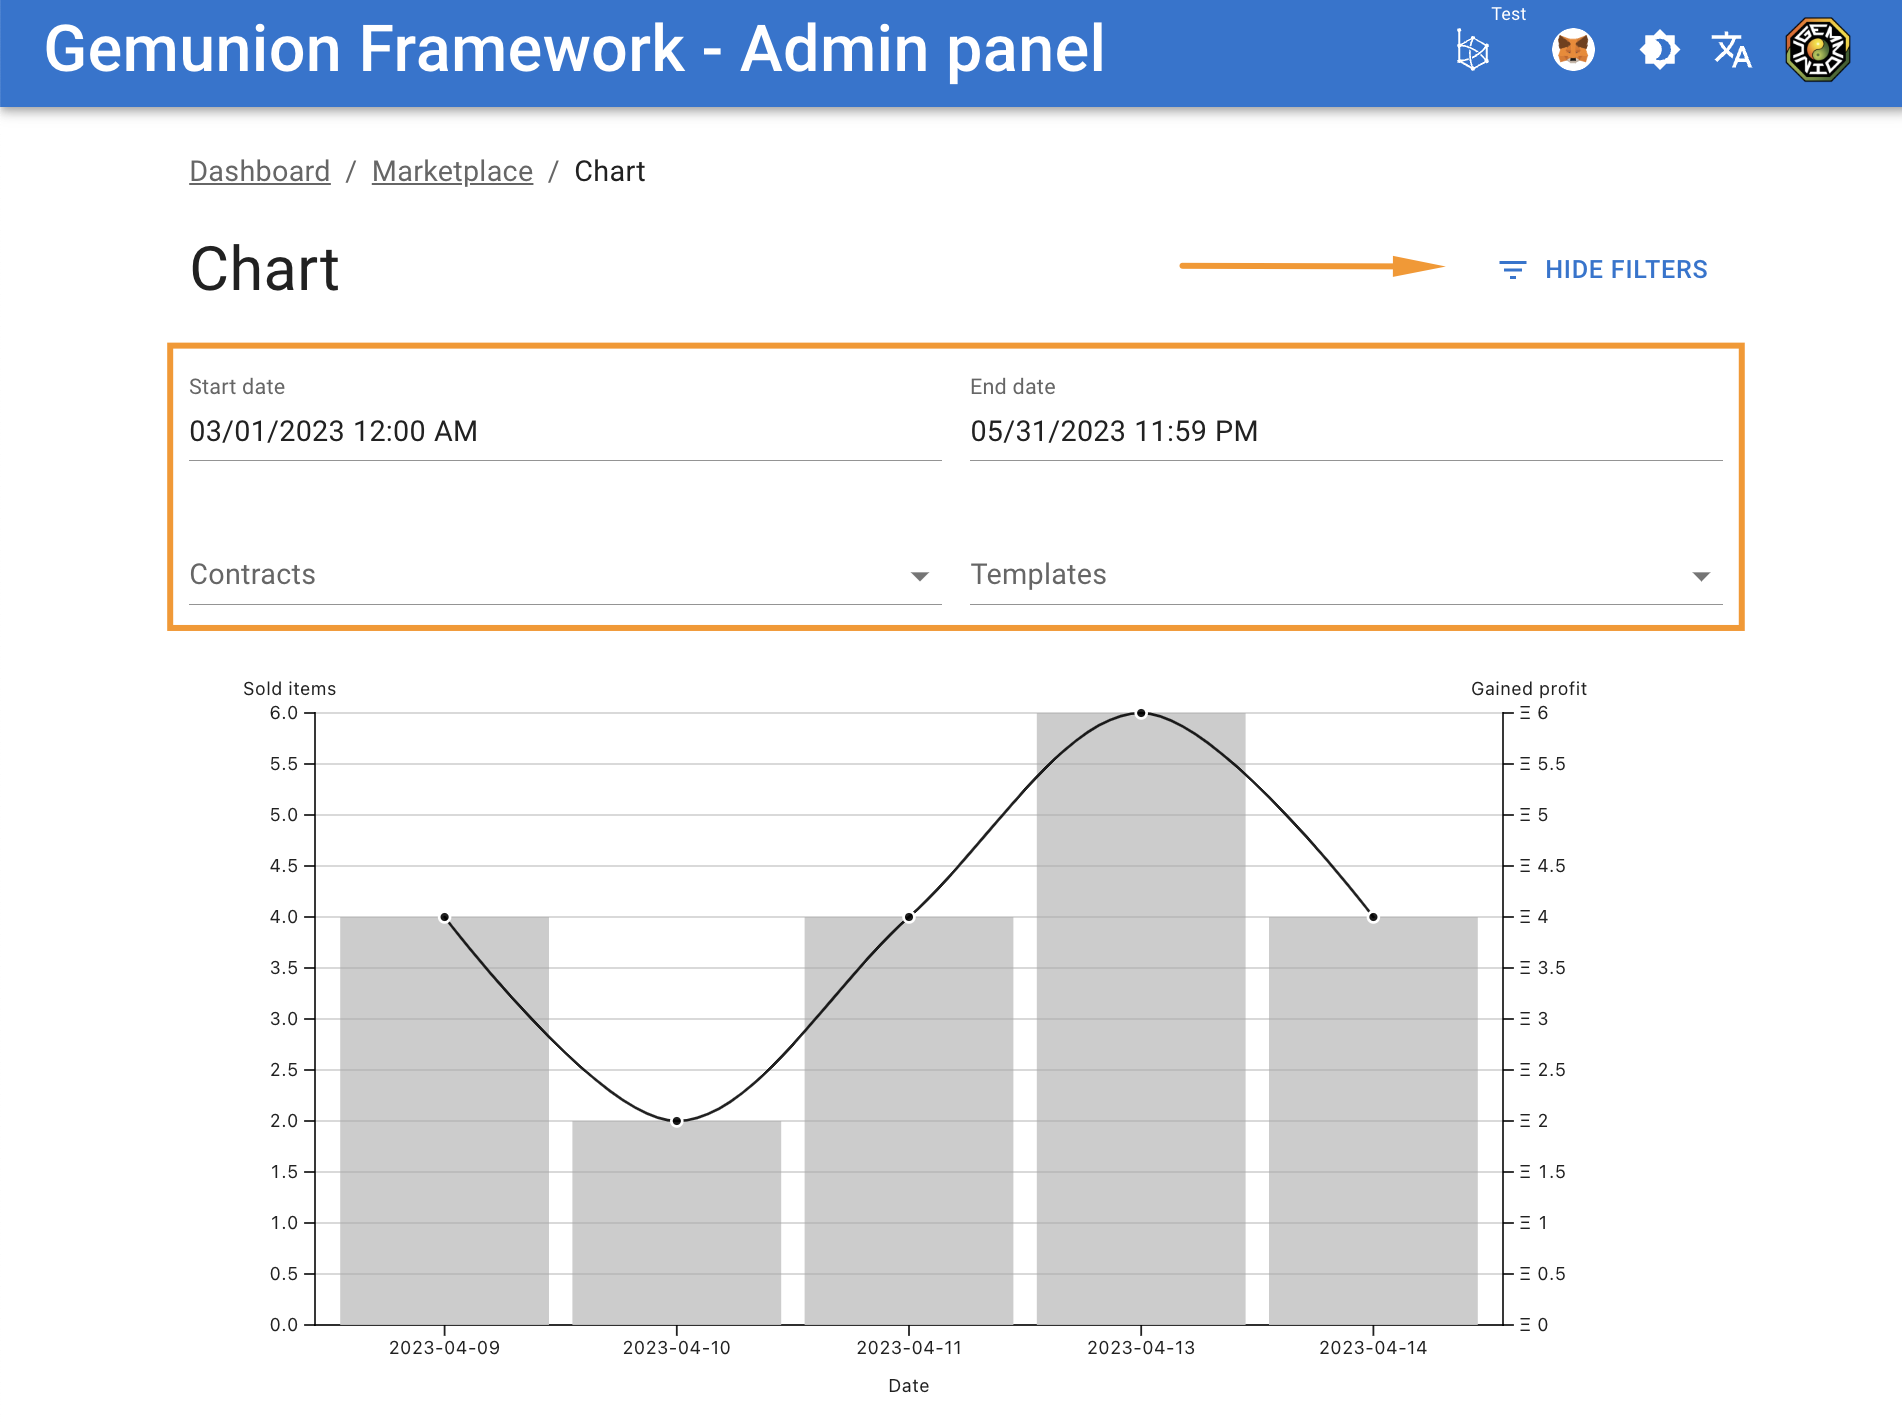
Filter
You can filter chart by several properties:
- Start date: The date from which purchases will be displayed.
- End date: The date until which purchases will be displayed.
- Contract: The contract of the token being purchased.
- Template: The template of the token being purchased.